

Research Shows What, or Does It? How B2B Marketers Can Separate Credible Findings From Promotional Claims
Eight Warning Signs of Questionable Research
A Practical Review Before Publishing
Click here to subscribe to the ESM weekly e-newsletter.
 Business-to-busines marketing is flooded with surveys, indexes, benchmarks, case studies, and sponsored reports created to generate publicity and establish thought leadership. Much of this research is useful. Some of it, however, begins with the headline the sponsor wants and works backward to find statistics that appear to support it. By promoting questionable findings, marketers risk damaging the credibility of their companies, executives, media partners, and industries.
Alex Edmans, Professor of Finance at London Business School and author of May Contain Lies: How Stories, Statistics, and Studies Exploit Our Biases—and What We Can Do About It, offers a useful way to evaluate such claims. His “Ladder of Misinference” warns that a statement is not necessarily a fact; a fact is not necessarily representative data; data are not necessarily evidence; and evidence is not necessarily proof.
The central lesson for marketers is that the numbers in a report can be technically accurate while the headline and conclusions remain misleading. The importance of using research properly is compounded by the fact that anyone today can run a basic query to determine the validity of research. For instance, here’s a sample AI query anyone can use to evaluate research.
Sample query: Critically evaluate this research for objectivity, credibility, and demonstrable business value. Identify:
- Who funded and conducted it, and any potential bias.
- Whether the sample, methodology, questions, and calculations are disclosed and appropriate.
- Whether the conclusions match the data.
- Any confusion between correlation and causation.
- Missing context, weak comparisons, small sample sizes, or exaggerated percentages.
- Whether the results are statistically and practically meaningful.
- Whether the research demonstrates measurable business outcomes or merely opinions and associations.
- What additional evidence would be needed to validate the claims.
Eight Warning Signs of Questionable Research
1. The research perfectly supports the sponsor’s commercial message. A sponsor’s involvement does not invalidate research, but concern is justified when every finding reinforces its product or service and no inconvenient or contradictory results appear.
2. The methodology is missing or incomplete. The report should explain who conducted and paid for the research, how respondents were recruited, when the study was conducted, the size and composition of the sample, and how the data were analyzed.
3. The sample does not match the headline. A survey of recognition program users cannot automatically support a conclusion about “all employees.” A poll of conference attendees does not necessarily represent an industry. A large sample drawn from the wrong population remains a poor sample.
4. The questions and response choices are not disclosed. Wording can shape results. Questions may be leading, emotionally loaded, or structured to produce a preferred answer. Asking whether a program “improves engagement and productivity” also combines two separate questions into one.
5. Percentages are reported without context. A “200% increase” could mean an increase from one respondent to three. A dramatic subgroup finding may be based on only 20 people. Readers need the underlying number of observations, the starting point, and the period measured.
6. An association is presented as proof of causation. Sales may rise after an incentive program, but that does not prove the program caused the increase. Pricing, seasonality, new distribution, market conditions, competitive changes, or better management could also explain the result.
7. Confusion between correlation and causation. The research makes claims about impact and results with no clear way to determine whether the findings include a correlation or cause.
8. The lack of a control group. A claim is made that the performance of a specific group increased, without any control group against which to compare the results.
11 Indicators of Research Worth Examining
Good research does not have to be perfect. It should, however, make it possible for readers to understand how the researchers reached their conclusions and any caveats involved.
1. It clearly defines the question being examined. Credible research starts with a specific question or hypothesis rather than a broad attempt to prove that a product, service, or management practice “works.” A strong study might ask whether employees participating in a specific recognition program had lower voluntary turnover over 12 months than comparable employees who did not participate. That is more meaningful than asking whether “recognition improves business performance.”
2. It identifies the sponsor and the researchers. Readers should know who financed the study, who designed it, who collected the data, and who performed the analysis. Commercial sponsorship is common and does not automatically undermine credibility. Transparency allows readers to consider potential conflicts of interest and determine whether an independent research organization had control over the methodology and findings.
3. It describes the population and the sample. The report should say exactly who was studied—not simply refer to “business leaders,” “employees,” or “consumers.” Useful disclosures include:
- The total number of respondents.
- The industries, company sizes, job levels, or geographic areas represented.
- The number of respondents in important subgroups.
- Eligibility requirements for participating.
- How respondents were recruited.
4. It explains how the sample was selected. Good research distinguishes between a random or probability sample and a convenience sample recruited from customers, email subscribers, social media followers, conference attendees, or online panels. Convenience samples can still provide useful information, but the conclusions should be limited to the people studied. Researchers should not describe a survey of their customers as representative of the entire marketplace without evidence supporting that claim.
5. It publishes the questions and response choices. Readers should be able to see what respondents were actually asked. Strong survey research discloses:
- Exact question wording.
- The order of the questions.
- Available response choices.
- Definitions supplied to respondents.
- Whether respondents could select more than one answer.
- How “don’t know” or incomplete responses were treated.
6. It reports underlying numbers as well as percentages. A credible study does not rely solely on dramatic percentages.For example, “turnover declined 25%” is difficult to evaluate without knowing whether turnover fell from 20% to 15%, from 4% to 3%, or from four employees to three. The report should provide the starting value, ending value, number of observations, and time period. When subgroup findings are highlighted, the report should disclose the number of respondents in each group. Percentages based on very small groups can fluctuate dramatically and should be treated cautiously.
7. It provides an appropriate comparison. A result has little meaning without a relevant baseline. Depending on the study, a useful comparison might include:
- Results before and after an intervention.
- Participants versus similar nonparticipants.
- One business unit versus a comparable unit.
- Performance against a historical trend.
- Results against an industry benchmark.
- Outcomes compared with a control group.
8. It reports the size of the effect, not merely statistical significance. A result can be statistically significant without being commercially meaningful, particularly in a very large sample. A report should explain the magnitude of the difference. Did engagement increase by one percentage point or 15? Did turnover decline enough to offset the cost of the program? Did the improvement persist or disappear after several weeks? Confidence intervals or other estimates of uncertainty can further indicate how precise the result is. A narrow range generally supports greater confidence than a wide range, although neither eliminates the need to assess research design.
9. It considers alternative explanations and limitations. Credible researchers identify what the study cannot prove. They may acknowledge that participants were self-selected, that the study covered only one company, that economic conditions changed during the measurement period, or that the research relied on self-reported behavior rather than observed outcomes. This candor strengthens rather than weakens research. A report that claims to have no meaningful limitations is itself a warning sign.
10. The claims are proportional to the evidence. The language used in the report should reflect the strength of the research design. A survey can show what respondents reported, believed, remembered, or intended at a particular point in time. It usually cannot establish what caused a business result.
An observational study may identify a relationship between recognition and retention. A controlled experiment or carefully designed quasi-experiment may provide stronger evidence that recognition contributed to retention. Look for appropriately cautious words such as “suggests,” “is associated with,” or “is consistent with.” Words such as “proves,” “causes,” “ensures,” and “drives” should be reserved for studies capable of supporting those conclusions.
11. Is it peer- or independently reviewed? While having independent qualified experts or researchers review studies is often essential in academia, it is rare in business. Having a third-party credible source review research findings is an effective way to enhance its perceived value.
A Practical Review Before Publishing
Before using research in an article, sales presentation, press release, or executive briefing, marketers should ask: Who was studied, how were they selected, what exactly were they asked, what numbers support the conclusion, and does the evidence justify the headline?
Marketers should also examine whether the report discloses unfavorable findings, distinguishes correlation from causation, provides a meaningful comparison group, and explains possible limitations.
A commercially sponsored study is not automatically unreliable, just as university research is not automatically correct. The issue is whether the methodology is transparent, the sample relevant, the analysis credible, and the claims no stronger than the evidence permits. The most effective thought leadership does not pretend to have discovered the final answer. It provides useful evidence, openly explains what that evidence can and cannot demonstrate, and gives readers enough information to make their own judgment.
In a marketplace overflowing with impressive-looking statistics, that level of intellectual honesty may be one of the most valuable marketing differentiators of all.
Enterprise Engagement Alliance Services
 Celebrating our 17th year, the Enterprise Engagement Alliance helps organizations enhance performance through:
1. Information and marketing opportunities on stakeholder management and total rewards:
- ESM Weekly on stakeholder management since 2009. Click here to subscribe; click here for media kit.
- RRN Weekly on total rewards since 1996. Click here to subscribe; click here for media kit.
- EEA YouTube channel on enterprise engagement, human capital, and total rewards since 2020
 Management Academy to enhance future equity value for your organization.
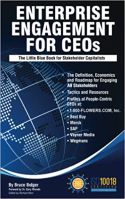
3. Books on implementation: Enterprise Engagement for CEOs and Enterprise Engagement: The Roadmap.
4. Advisory services and research: Strategic guidance, learning and certification on stakeholder management, measurement, metrics, and corporate sustainability reporting.
5. Permission-based targeted business development to identify and build relationships with the people most likely to buy.
Contact: Bruce Bolger at TheICEE.org; 914-591-7600, ext. 230.